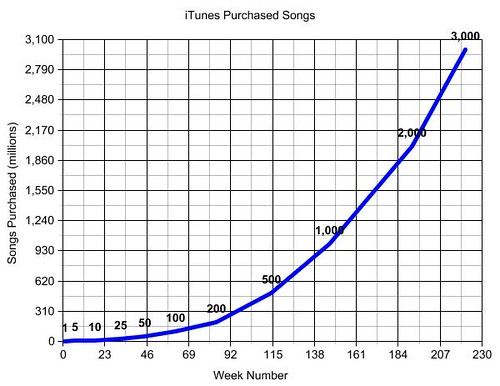
It took a little less than a year to go from 1 billion to 2 billion songs sold on iTunes. It took a little over six months to go from 2 billion to 3 billion songs sold. Will we see 4 billion songs sold by the end of the year?
|
Date |
Songs Purchased (millions) |
Source |
| 05/15/2003 | 1 | Apple |
| 06/23/2003 | 5 | Apple |
| 09/8/2003 | 10 | Apple |
| 12/15/2003 | 25 | Apple |
| 03/15/2004 | 50 | Apple |
| 07/12/2004 | 100 | CNN |
| 12/16/2004 | 200 | Apple |
| 07/18/2005 | 500 | Apple |
| 02/24/2006 | 1000 | Apple |
| 01/09/2007 | 2000 | Apple |
| 07/31/2007 | 3000 | Apple |
Analysis elsewhere:
- The Unofficial Apple Weblog
- Blackfriars’ Marketing
- B2.0-The Utility Belt
- Epicenter
- Download Squad
- Good Morning Silicon Valley
- MacUser
graph created using NCES Create a Graph